- Introduction
- The skeleton and its properties
- Skeletonization techniques
- Medical applications
- Assessment of Laryngotracheal Stenosis
- Assessment of Infrarenal Aortic Aneurysms
- Unravelling the Colon
- Assessment of Laryngotracheal Stenosis
The aim of the skeletonization is to extract a region-based shape feature representing the general form of an object.
We have applied skeletonization to extract the central path of a 3D "tubular" object.
The skeleton and its properties
The notion skeleton was introduced by H. Blum as a result of the Medial Axis Transform (MAT) or Symmetry Axis Transform (SAT). The MAT determines the closest boundary point(s) for each point is in an object. An inner point belongs to the skeleton if it has at least two closest boundary points.
A very illustrative definition of the skeleton is given by the prairie-fire analogy: the boundary of an object is set on fire and the skeleton is the loci where the fire fronts meet and quench each other.
The third approach provides a formal definition: the skeleton is the locus of the centers of all maximal inscribed hyper-spheres (i.e., discs and balls in 2D and 3D, respectively). (An inscribed hyper-sphere is maximal if it is not covered by any other inscribed hyper-sphere.)
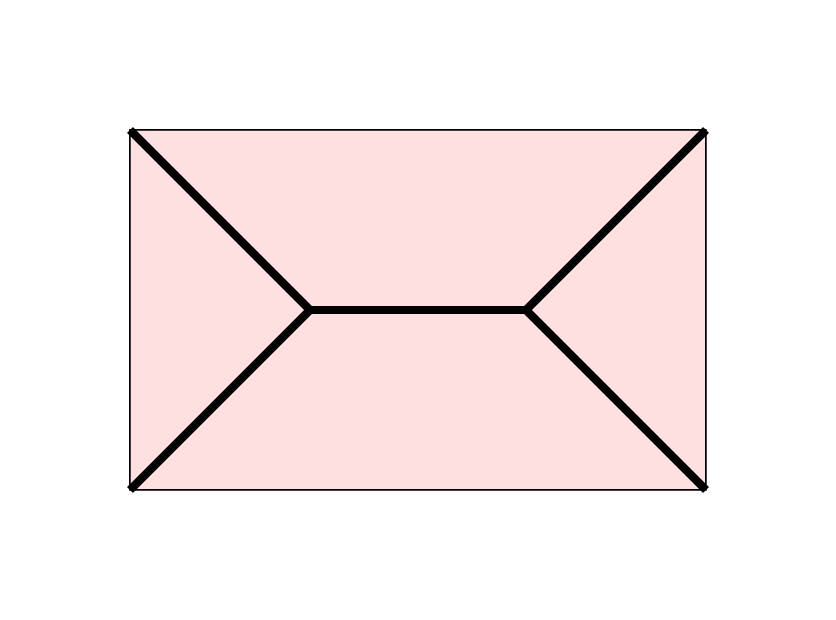
Skeleton of a rectangle:
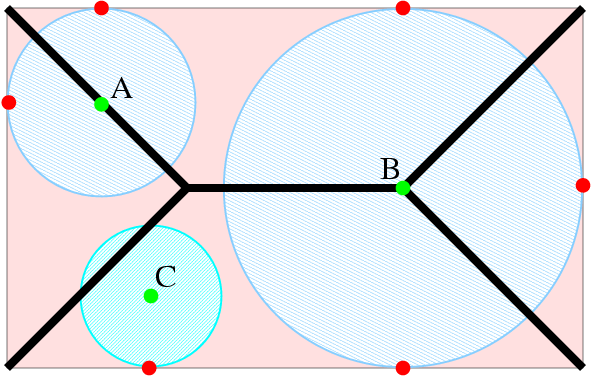
Both points A and B are skeletal,
but point C does not belong to the skeleton.
(The skeleton is marked by thick black line segments.)
Skeleton of a solid box:
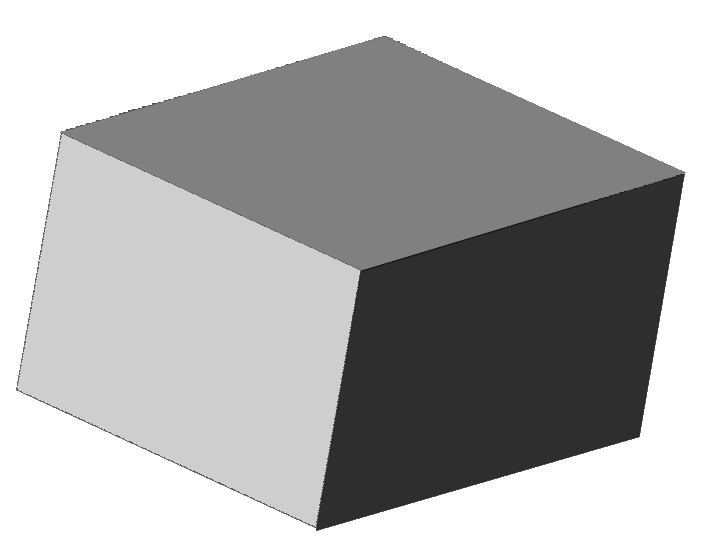
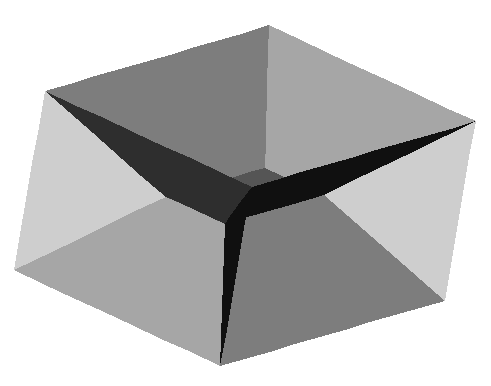
Skeletons in 3D generally contain surface patches.
(The original object (left) and its skeleton (right).)
Uniqueness:
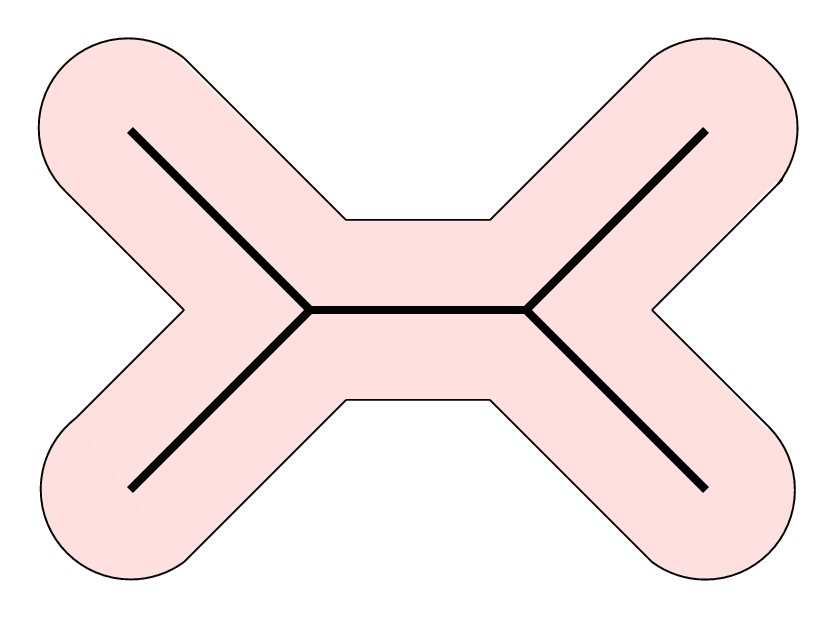
The same skeleton may belong to different elongated objects.
Stability:
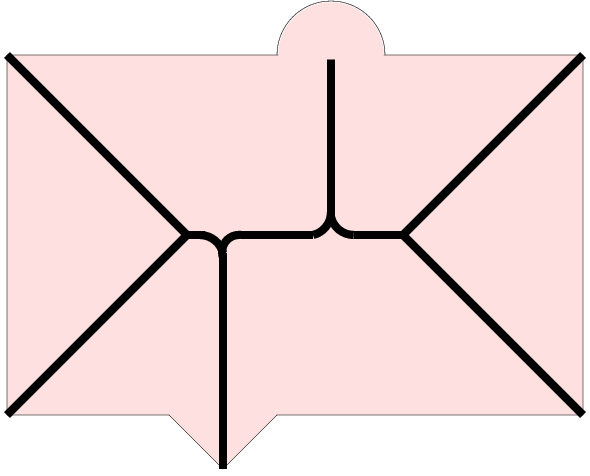
A rectangle with boundary disturbance.
Additional important properties:
The skeleton is thin.
It contains much less points than the
original elongated object (therefore it is an object
reduction).
The skeleton represents: local object symmetries, and
the topological structure of the object.
Skeletonization (i.e., skeleton extraction from a digital binary picture) provides region-based shape features. It is a common preprocessing operation in raster-to-vector conversion or in pattern recognition.
There are three major skeletonization techniques:
- detecting ridges in distance map of the boundary points,
- calculating the Voronoi diagram generated by the boundary points, and
- the layer by layer erosion called thinning.
In digital spaces, only an approximation to the "true skeleton" can be extracted. There are two requirements to be complied with:
- topological
(to retain the topology of the original object),
- geometrical
(forcing the "skeleton" being in the middle of the object and
invariance under the most important geometrical transformation
including translation, rotation, and scaling)
Comparison of skeletonization techniques:
| method | geometrical | topological |
| distance transform | yes | no |
| Voronoi-skeleton | yes | yes |
| thinning | no | yes |
Skeletonization based on distance transformation requires the following 3-step process:
- The original (binary) image is converted into
feature and non-feature elements.
The feature elements belong to the boundary of the object.
- The distance map is generated where each element
gives the distance to the nearest feature element.
- The ridges (local extremes) are detected as skeletal points.
The distance map resulted by the distance transformation depends on the chosen distance.
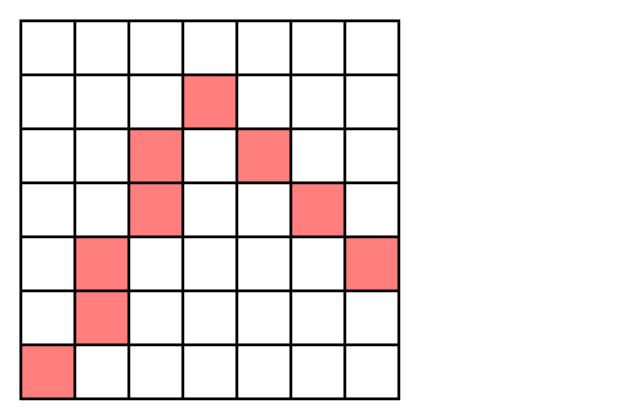
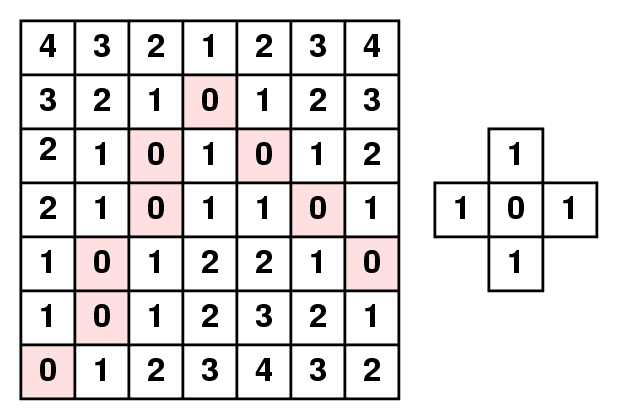
Extracted feature points are marked by pink squares (left) and
distance map using city block (or 4-neighbour) distance (right).
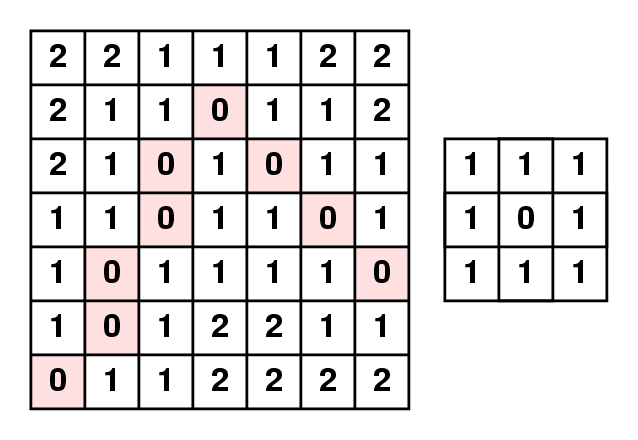
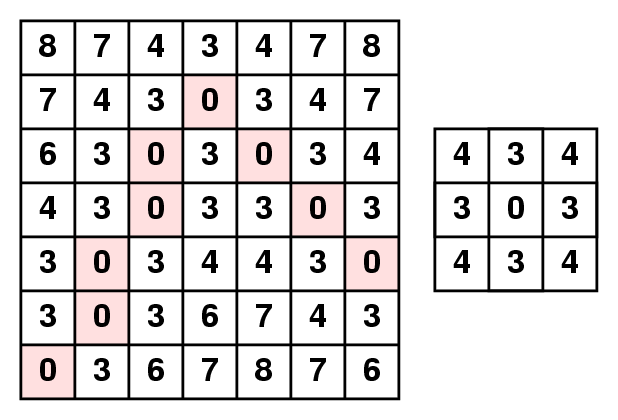
Distance map using chess-board (or 8-neighbour) distance (left) and
distance map using (3,4)-chamfer distance (right).
Example of distance transformation:
The original binary object (left) and its distance map (right).
(The distance map is displayed as a surface where the ridge points
belong to the skeleton.)
The distance transformation can be executed in linear (O(n)) time
in arbitrary dimensions (where "n" is the number of the image
elements (e.g. pixels or voxels)).
This method fulfils the geometrical requirement (if an error-free
Euclidean distance map is calculated), but the topological
correctness is not guaranteed.
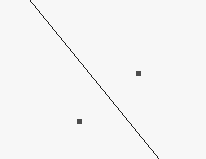
The Voronoi diagram of a discrete set of points (called generating points) is the partition of the given space into cells so that each cell contains exactly one generating point and the locus of all points which are nearer to this generating point than to other generating points.
Example of Voronoi diagrams:
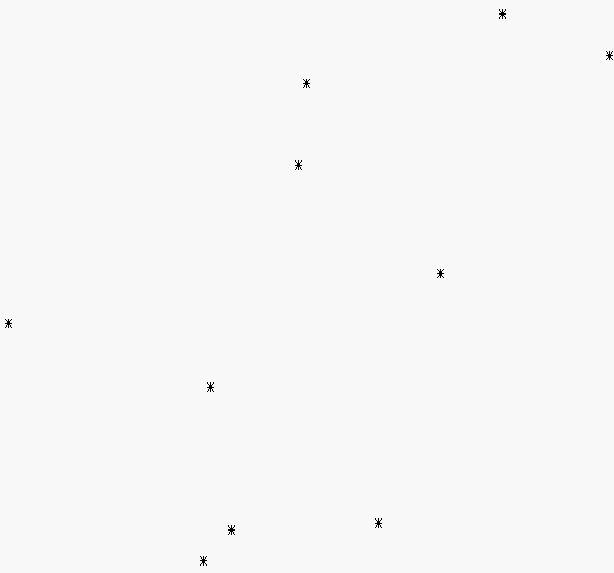
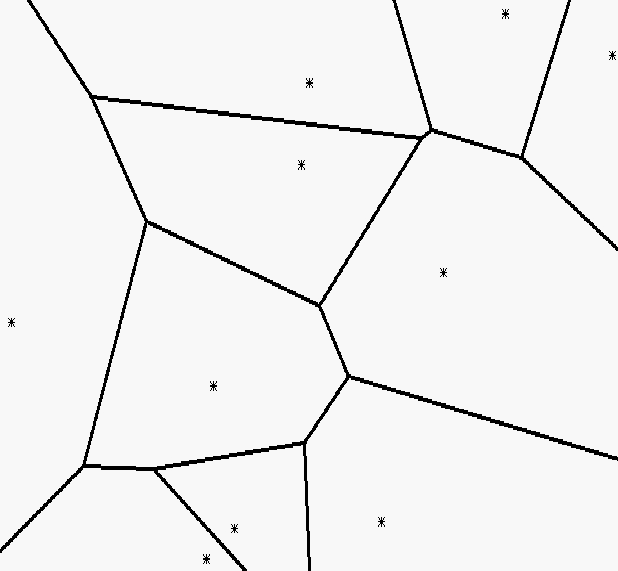
The 10 generating points (left) and
their Voronoi diagram (right).
The Voronoi diagrams can be computed by an incremental construction:
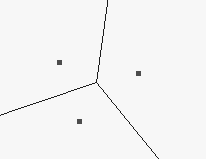
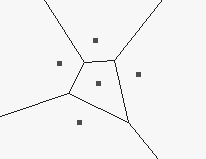
If the density of boundary points (as generating points) goes to infinity then the corresponding Voronoi diagram converges to the skeleton.
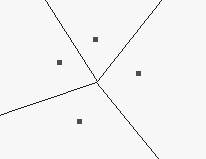
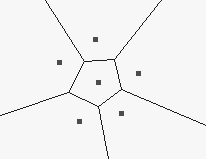
Example of Voronoi-skeleton:
Some border points of a rectangle form the
set of generating points.
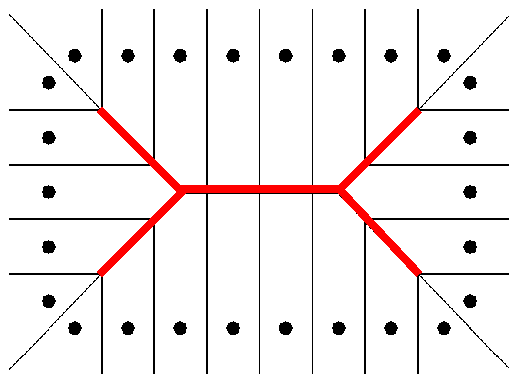
The skeleton (marked by red lines) is approximated by
a subgraph of the Voronoi diagram.
Both requirements (i.e, the topological and the geometrical)
can be fulfilled by the skeletonization based on Voronoi diagrams,
but it is an expensive process, especially for large and
complex objects.
It is an iterative object reduction technique for modelling fire propagation in digital spaces.
Example of thinning process:
The darkest voxels belong to the computed skeleton.
The thinning has some beneficial properties:
- It preserves the topology
(retains the topology of the original object),
- It preserves the shape
(significant feature suitable for object recognition or
classification is extracted),
- It forces the "skeleton" being in the middle of
the object, and
- It produces one pixel/voxel width "skeleton".
Example of a 2D reduction operation that does not
preserve the topology:
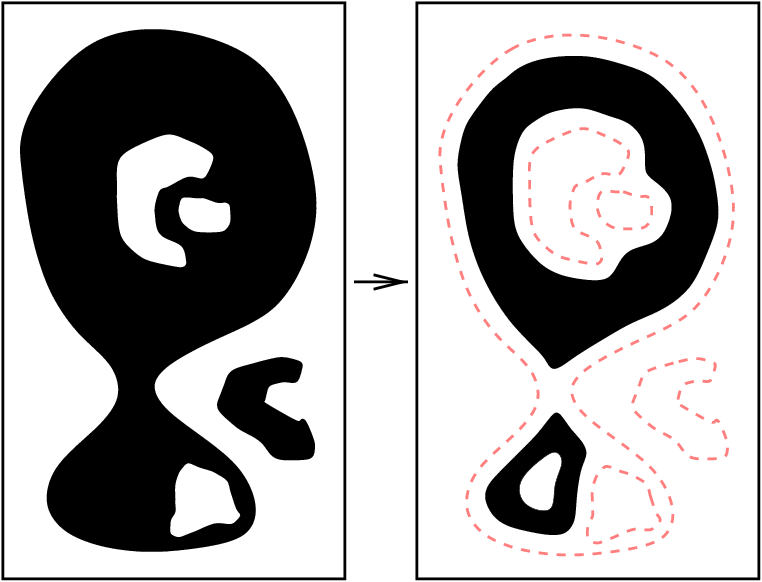
It does not preserve the topology, since
There is a new concept called hole in 3D pictures. A hole (that a doughnut has) is formed by white points, but it is not a cavity. Topology preservation implies that eliminating or creating holes is not allowed.
Example of a 3D reduction operation that does not
preserve the topology:
The original object (left) and the result of
the reduction (right).
It does not preserve the topology, since
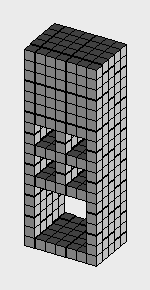
Example of the shape preserving thinning:

The original object (top) and the result of
the thinning (bottom).
The text remains readable.
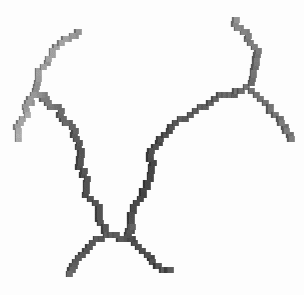
Example of 2D thinning:
The original object and its medial lines.
The produced types of 3D skeleton depends on the chosen endpoints to be preserved: curve thinning preserves line-end points, surface thinning do not delete surface-end points, and shrinking (that extracts the topological kernel of an object) does not consider endpoints.
Examples of different types of thinning processes:
The original object (left) and
its medial surface (right).
The medial lines (left) and
the topological kernel (right).
Each thinning algorithm can be sketched by the following program:
       repeat
          change "deletable" black points to white
       until no points are deleted
We have proposed some 3D thinning algorithms:
-
K. Palágyi, E. Sorantin, E. Balogh, A. Kuba,
Cs. Halmai, B. Erdôhelyi, K. Hausegger:
A sequential 3D thinning algorithm and its medical applications,
in Proc. 17th Int. Conf. Information Processing in Medical Imaging, IPMI 2001, Davis, USA, Lecture Notes in Computer Science, Springer, 2001, to appear
-
K. Palágyi:
A 3D 3-subiteration thinning algorithm for medial surfaces,
in Proc. 9th Int. Conf. Discrete Geometry for Computer Imagery, DGCI 2000, Uppsala, Sweden,
Lecture Notes in Computer Science 1953, Springer, 2000, 406-417.
-
K. Palágyi, A. Kuba:
A parallel 3D 12-subiteration thinning algorithm,
Graphical Models and Image Processing 61, 1999, 199-221.
-
K. Palágyi, A. Kuba:
Directional 3D thinning using 8 subiterations,
in Proc. 8th Int. Conf. on Discrete Geometry for Computer Imagery, DGCI'99, Marne-la-Vallée, France,
Lecture Notes in Computer Science 1568, Springer, 1999, 325-336.
-
K. Palágyi, A. Kuba:
A 3D 6-subiteration thinning algorithm for extracting medial lines,
Pattern Recognition Letters 19, 1998, 613-627.
-
K. Palágyi, A. Kuba:
A hybrid thinning algorithm for 3D medical images,
J. Computing and Information Technology 6, 1998, 149-164.
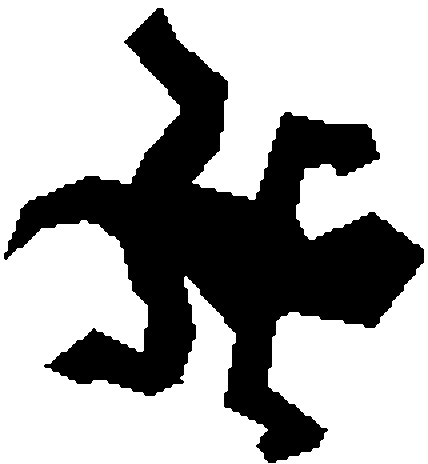
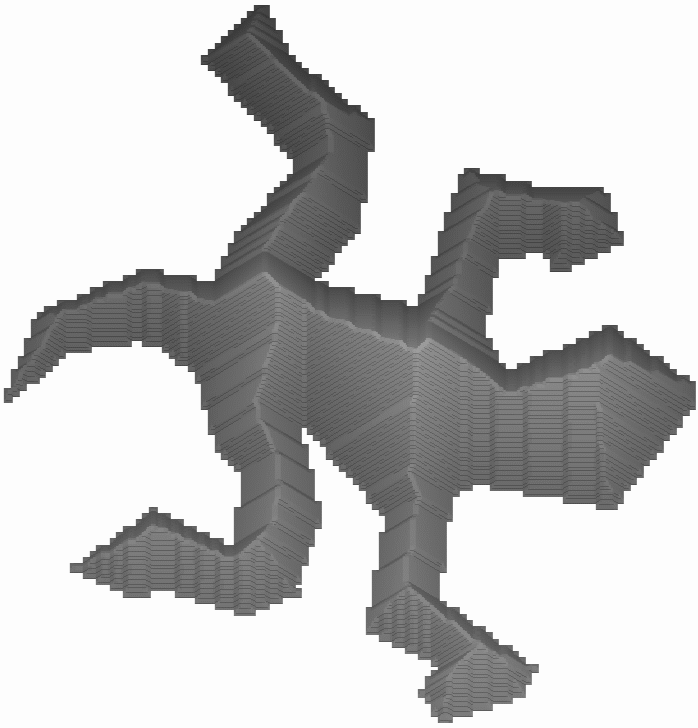
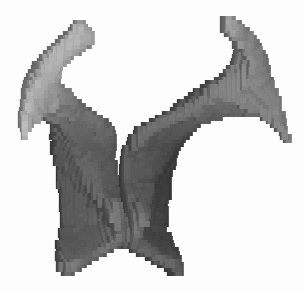
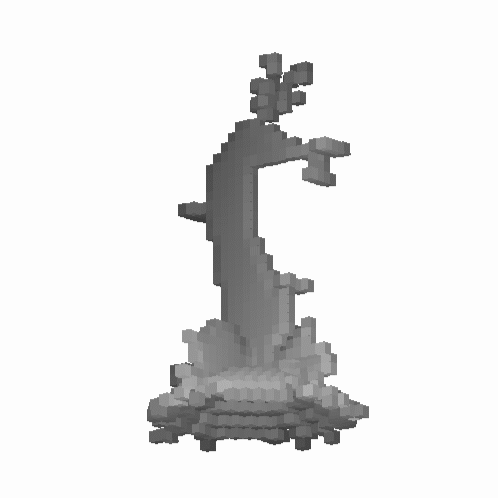
Results of 3D thinning:
A segmented human ventricle as an original object (left) and
its medial lines (right).
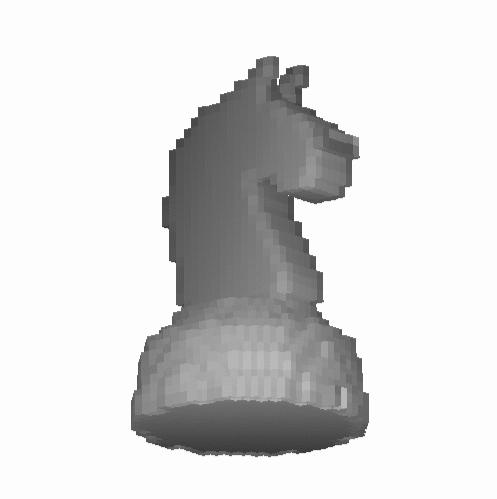
A knight (left) and
its medial surface (right).
The skeletonization has been successfully applied in the following three medical applications:
- assessment of laryngotracheal stenosis,
- assessment of infrarenal aortic aneurysm, and
- unravelling the colon.
Each of the emerged three applications requires the cross-sectional profiles of the investigated tubular organs. The proposed process is sketched as follows:
- image acquisition by Spiral Computed Tomography (S-CT),
- (semiautomatic snake-based) segmentation
(i.e., determining a binary object from the gray-level picture,
- morphological filtering of the segmented object,
- curve thinning (by using one of our 3D thinning algorithm),
- raster-to-vector conversion,
- pruning the vector structure (i.e., removing the unwanted branches),
- smoothing the resulted central path, and
- calculation of the cross-sectional profile orthogonal to the
central path.
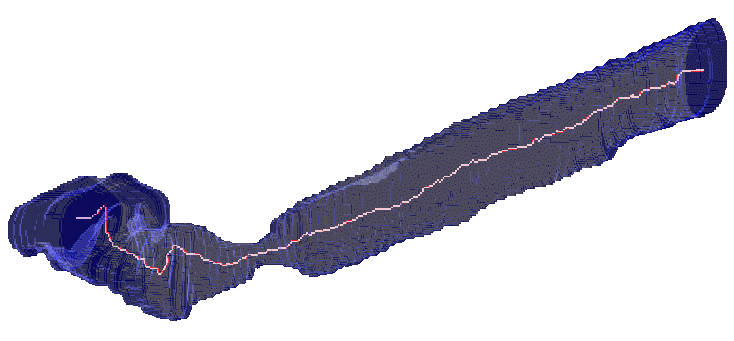
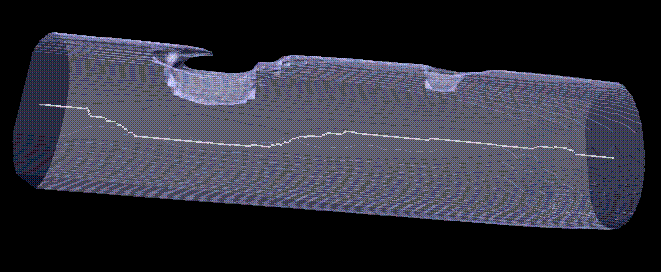
Assessment of Laryngotracheal Stenosis
Many conditions can lead to laryngotracheal stenosis (LTS), most frequent endotracheal intubation, followed by external trauma, or prior airway surgery. Clinical management of these stenosis requires exact information about the number, grade, and the length of the stenosis. We have developed a method for assessment of LTS. The cross-sectional profiles (based on the central path) of the upper respiratory tract (URT) were calculated for 30 patients with proven LST on fiberoptic endoscopy (FE). Locations of LTS were determined on axial S-CT slices and compared to findings of fiberoptic endoscopy (FE) by Cohen's kappa statistics. Regarding the site of LTS an excellent correlation was found between FE and S-CT (z=7.44, p<0.005). Site of LTS, length and degree could be depicted on the URT cross-sectional charts in all patients.
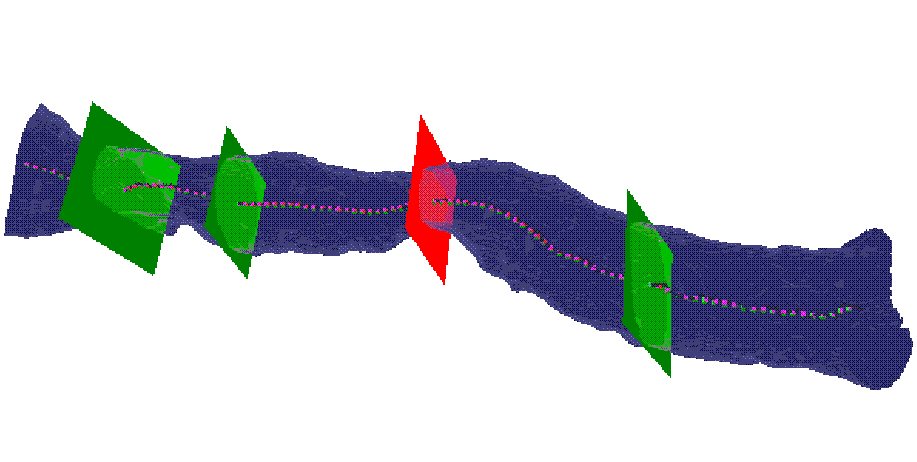
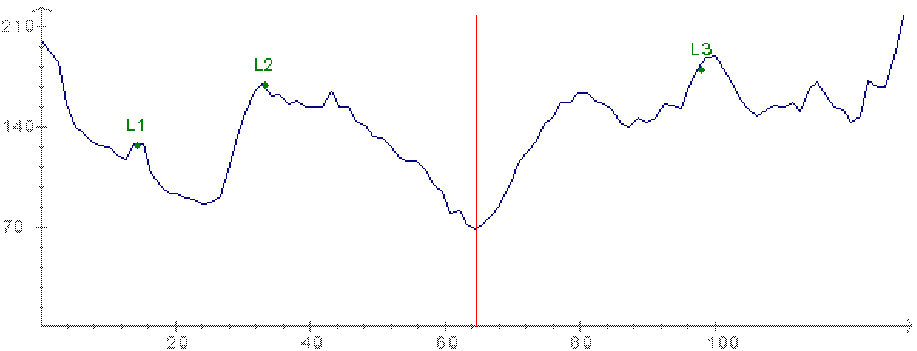
The segmented URT, its central path, and its cross--sectional profile
at the three landmarks (vocal cords, caudal border of the cricoid cartilage,
and cranial border of the sternum) and at the narrowest position (top);
the line chart (bottom).
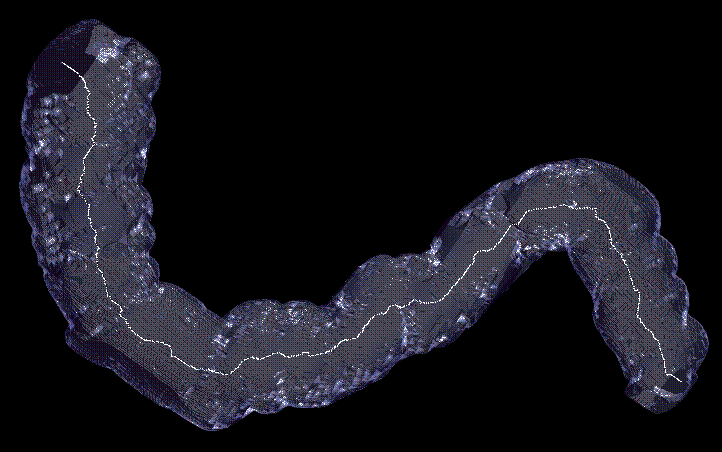
Assessment of Infrarenal Aortic Aneurysm
We used the cross-sectional profile in patients suffering from infra-renal aortic aneurysms (AAA). AAA are abnormal dilatations of the main arterial abdominal vessel due to atherosclerosis. AAA can be found in 2% of people older than 60 years. If the diameter is more than 5 cm than the person is at high risk for AAA rupture, which leads to death in 70-90%. For therapy two main options exist: surgery or endoluminal repair with stentgrafts. For optimal patient management the "true diameter" in 3D as well as the distance to the origin of the renal arteries (proximal aneurysma neck) as well as the extension to the iliac arteries (distal aneurysma neck) have to be known.
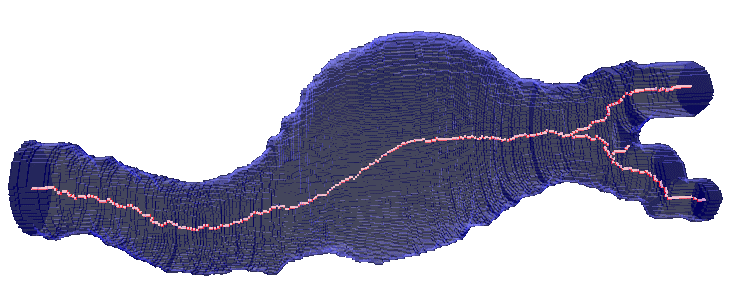
The segmented part of the infrarenal aorta and its central path.
Along the central path the cross-sectional profile was computed.
The following parameters could be derived
from this approach: the maximum diameter in 3D as well as the length of
the proximal and distal neck of the aneurysma. Since size of the
aneurysma is regarded to be a prognosticated factor, the volume of the
segmented aneurysma was determined too. At follow-up investigations the
same parameters were derived.
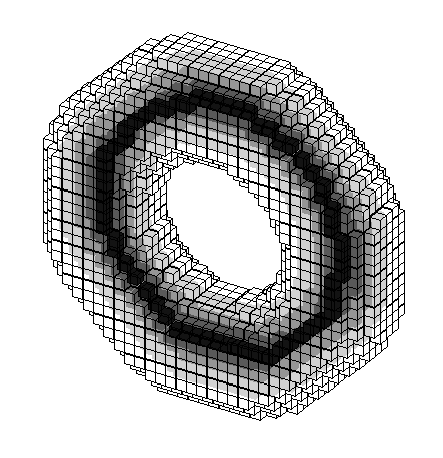
In order to investigate the correctness of the applied 3D thinning algorithms, some mathematical phantoms were created.
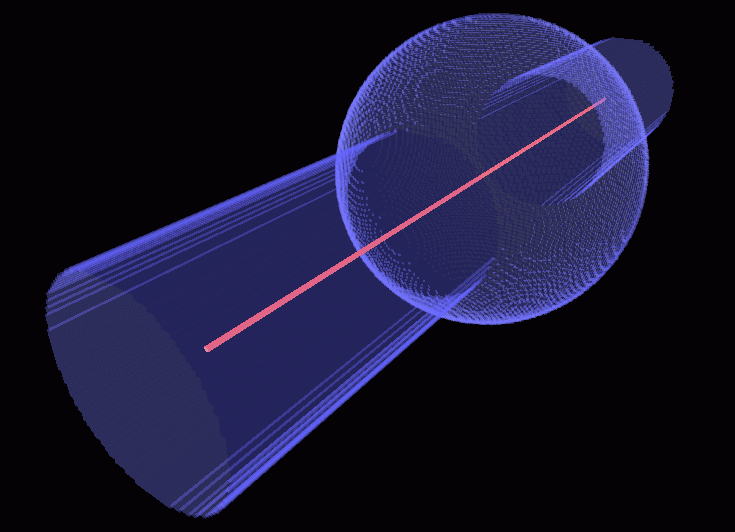
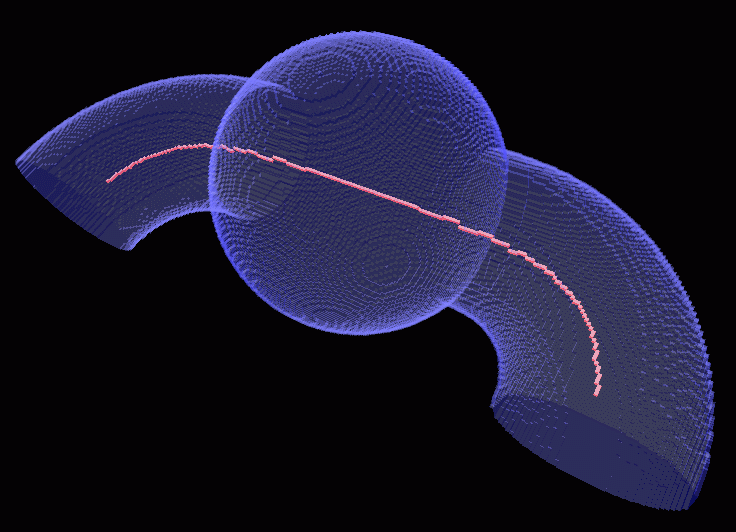
Two phantoms and their central paths.
Unravelling the colon is a new method to visualize the entire inner surface of the colon without the need for navigation. This is a minimally invasive technique that can be used for colorectal polyps and cancer detection. We have proposed an algorithm for unravelling the colon which is to digitally straighten and then flatten using reconstructed spiral/helical computer tomograph (CT) images. Comparing to virtual colonoscopy where polyps may be hidden from view behind the folds, the unravelled colon is more suitable for polyp detection, because the entire inner surface is displayed at one view.
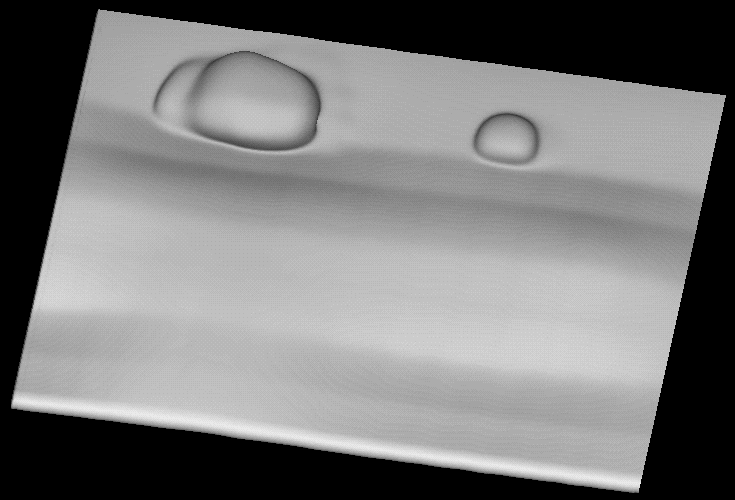
The segmented volume of a part of the artificial phantom
with two polyps (top)
and the same part of the phantom after unravelling (bottom).
The segmented volume of a part of the cadavric phantom
with polyps (top)
and the unravelled colon (bottom).